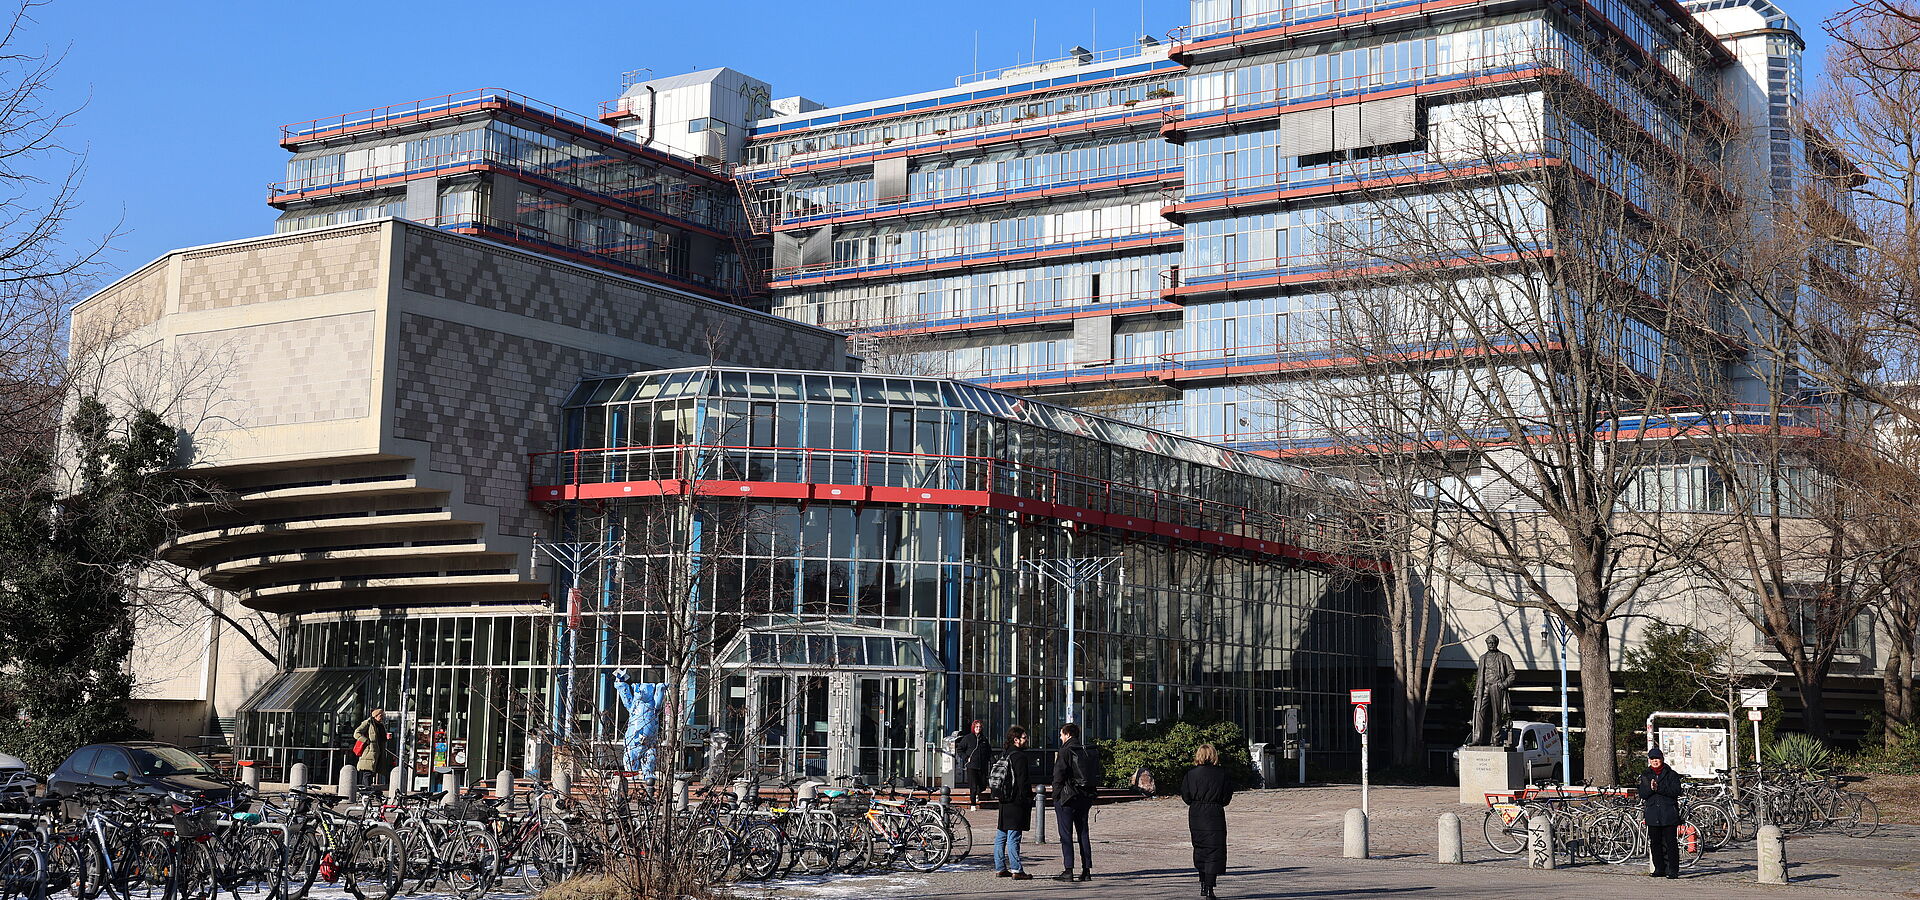
# # gaussTriangle(n) # # returns abscissas and weights for "Gauss integration" in the triangle with # vertices (-1,-1), (1,-1), (-1,1) # # input: # n - order of the numerical integration (1 <= n <= 5) # # output: # x - 1xp-array of abscissas, that are 1x2-arrays (p denotes the number of # abscissas/weights) # w - 1xp-array of weights (p denotes the number of abscissas/weights) # def gaussTriangle(n): if n == 1: x = [[-1/3., -1/3.]]; w = [2.]; elif n == 2: x = [[-2/3., -2/3.], [-2/3., 1/3.], [ 1/3., -2/3.]]; w = [2/3., 2/3., 2/3.]; elif n == 3: x = [[-1/3., -1/3.], [-0.6, -0.6], [-0.6, 0.2], [ 0.2, -0.6]]; w = [-1.125, 1.041666666666667, 1.041666666666667, 1.041666666666667]; elif n == 4: x = [[-0.108103018168070, -0.108103018168070], [-0.108103018168070, -0.783793963663860], [-0.783793963663860, -0.108103018168070], [-0.816847572980458, -0.816847572980458], [-0.816847572980458, 0.633695145960918], [ 0.633695145960918, -0.816847572980458]]; w = [0.446763179356022, 0.446763179356022, 0.446763179356022, 0.219903487310644, 0.219903487310644, 0.219903487310644]; elif n == 5: x = [[-0.333333333333333, -0.333333333333333], [-0.059715871789770, -0.059715871789770], [-0.059715871789770, -0.880568256420460], [-0.880568256420460, -0.059715871789770], [-0.797426985353088, -0.797426985353088], [-0.797426985353088, 0.594853970706174], [ 0.594853970706174, -0.797426985353088]]; w = [0.450000000000000, 0.264788305577012, 0.264788305577012, 0.264788305577012, 0.251878361089654, 0.251878361089654, 0.251878361089654]; else: print 'numerical integration of order ' + str(n) + 'not available'; return x, w # # plot(p,t,u) # # plots the linear FE function u on the triangulation t with nodes p # # input: # p - Nx2 matrix with coordinates of the nodes # t - Mx3 matrix with indices of nodes of the triangles # u - Nx1 coefficient vector # def plot(p,t,u): import matplotlib.pyplot as plt from mpl_toolkits.mplot3d import Axes3D fig = plt.figure() ax = fig.add_subplot(111, projection='3d') ax.plot_trisurf(p[:, 0], p[:, 1], t, u, cmap=plt.cm.jet) ax.set_xlabel('x') ax.set_ylabel('y') ax.set_zlabel('u') plt.show()